Case Study 10 / 27EPC Project Controls / Mining Operations / Enterprise BI Suite
Vale Pomalaa Project Control & Operational Intelligence Suite
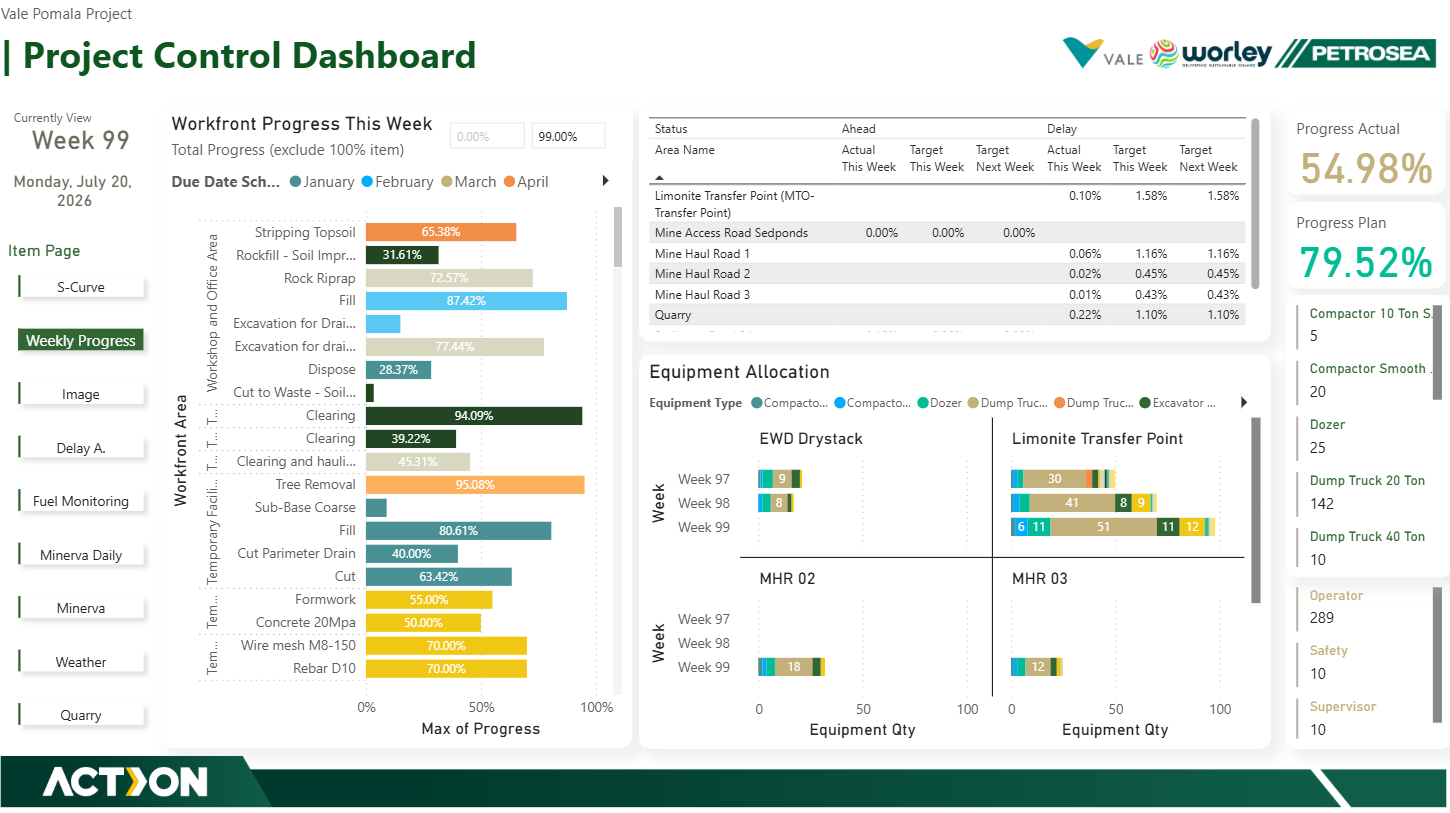
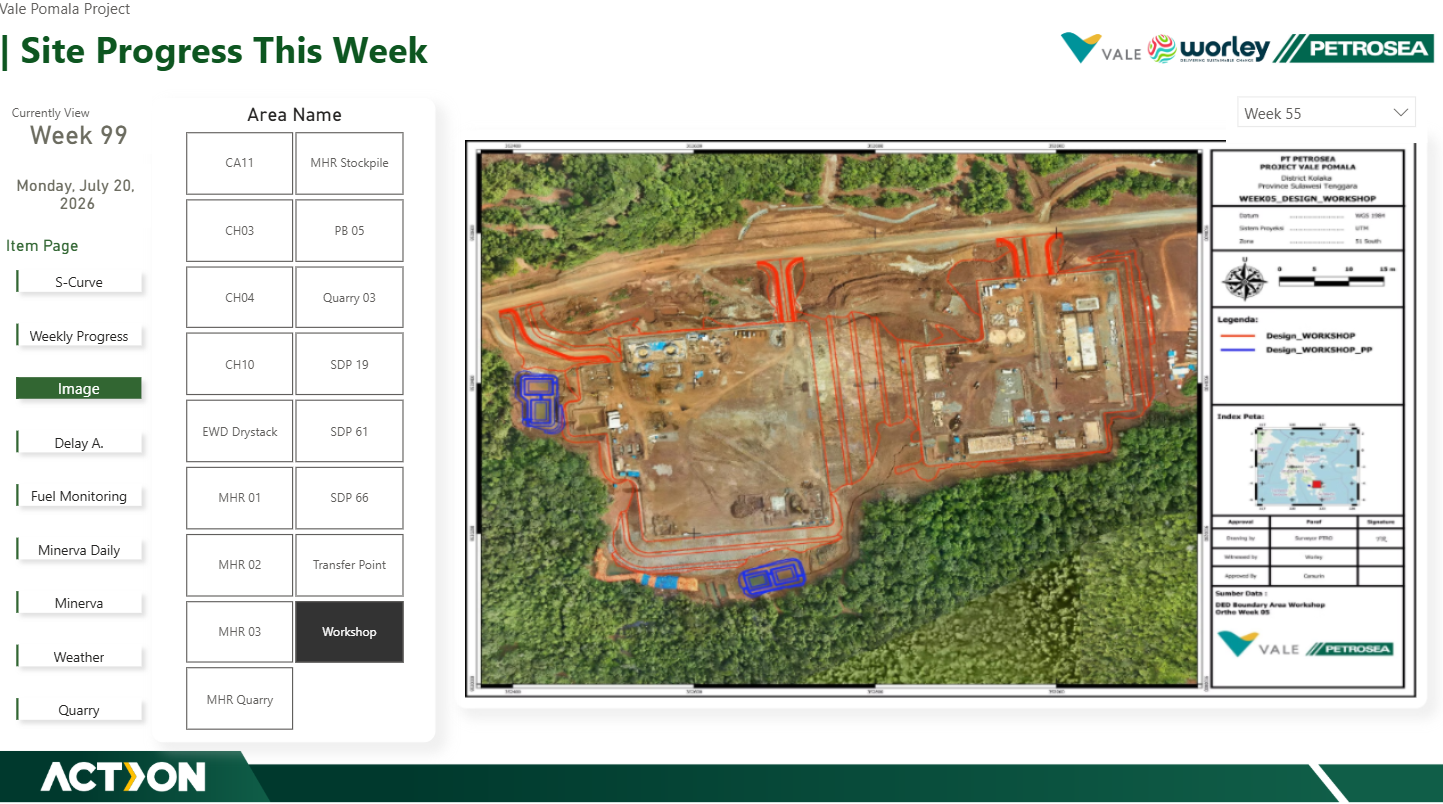
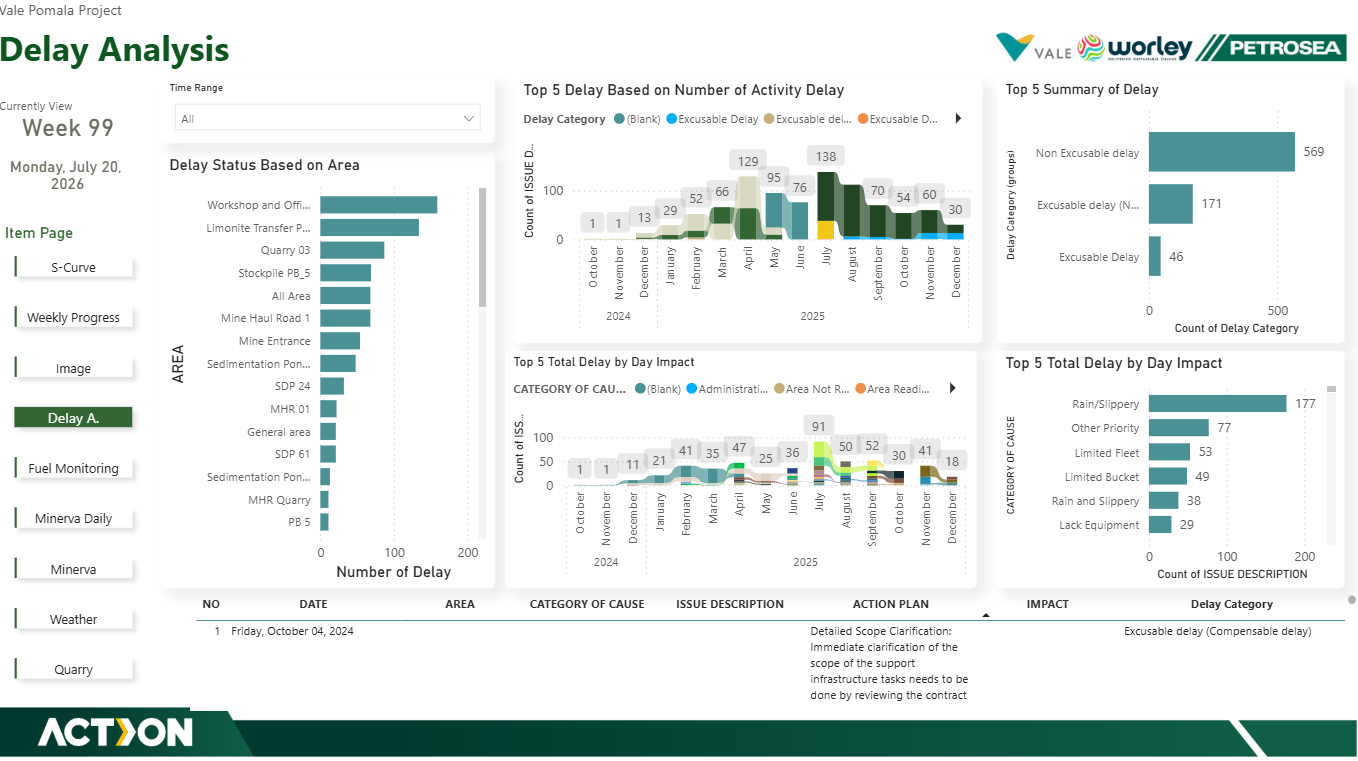
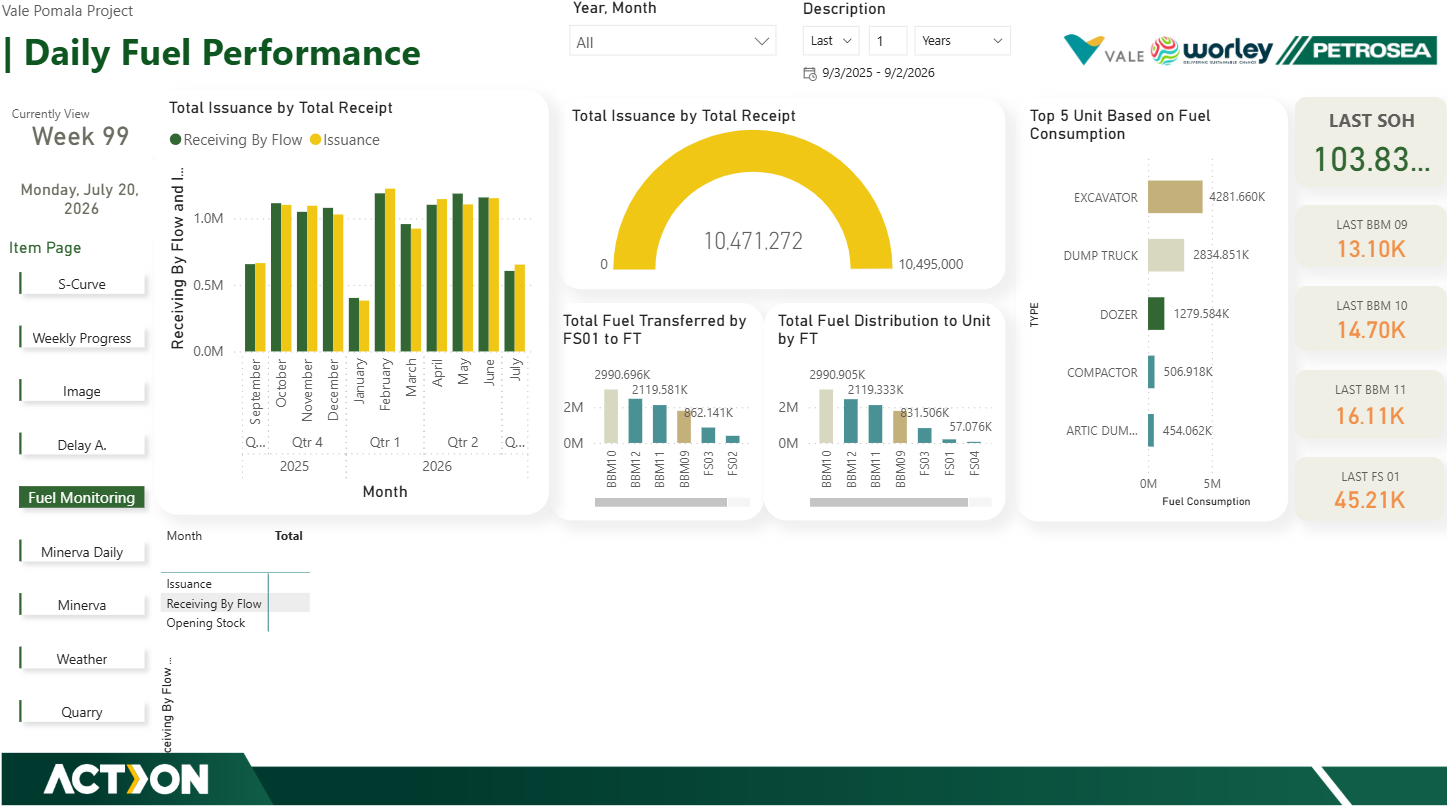
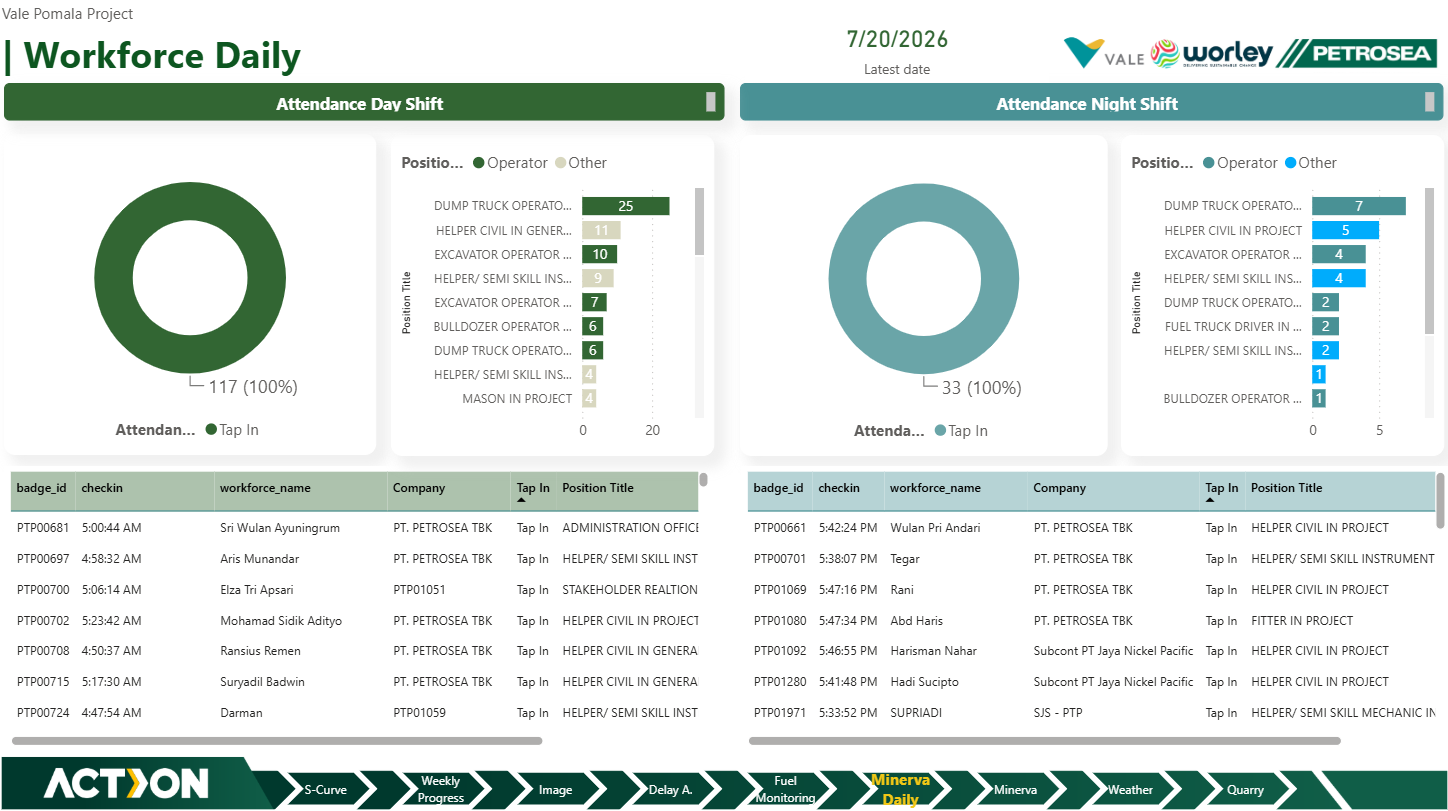
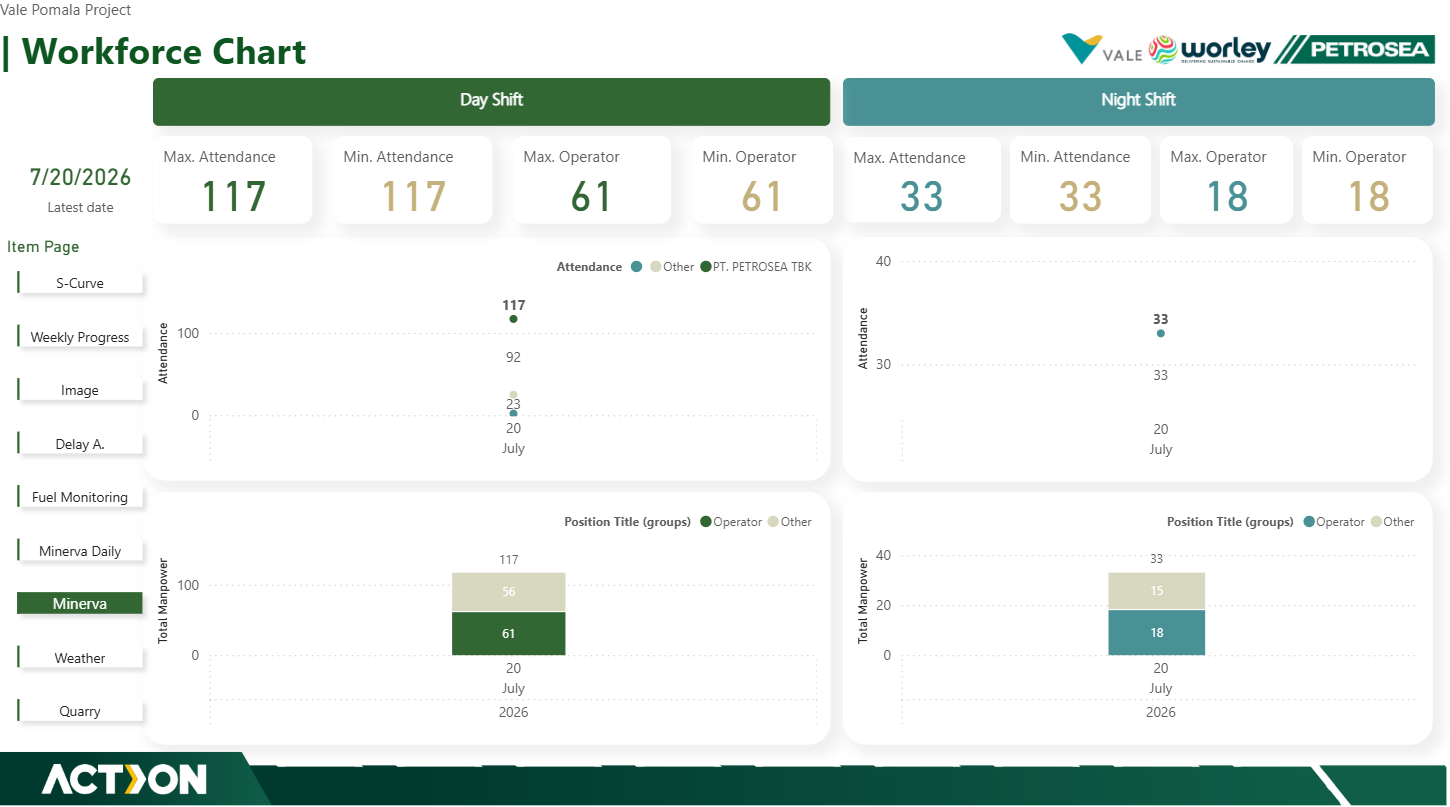
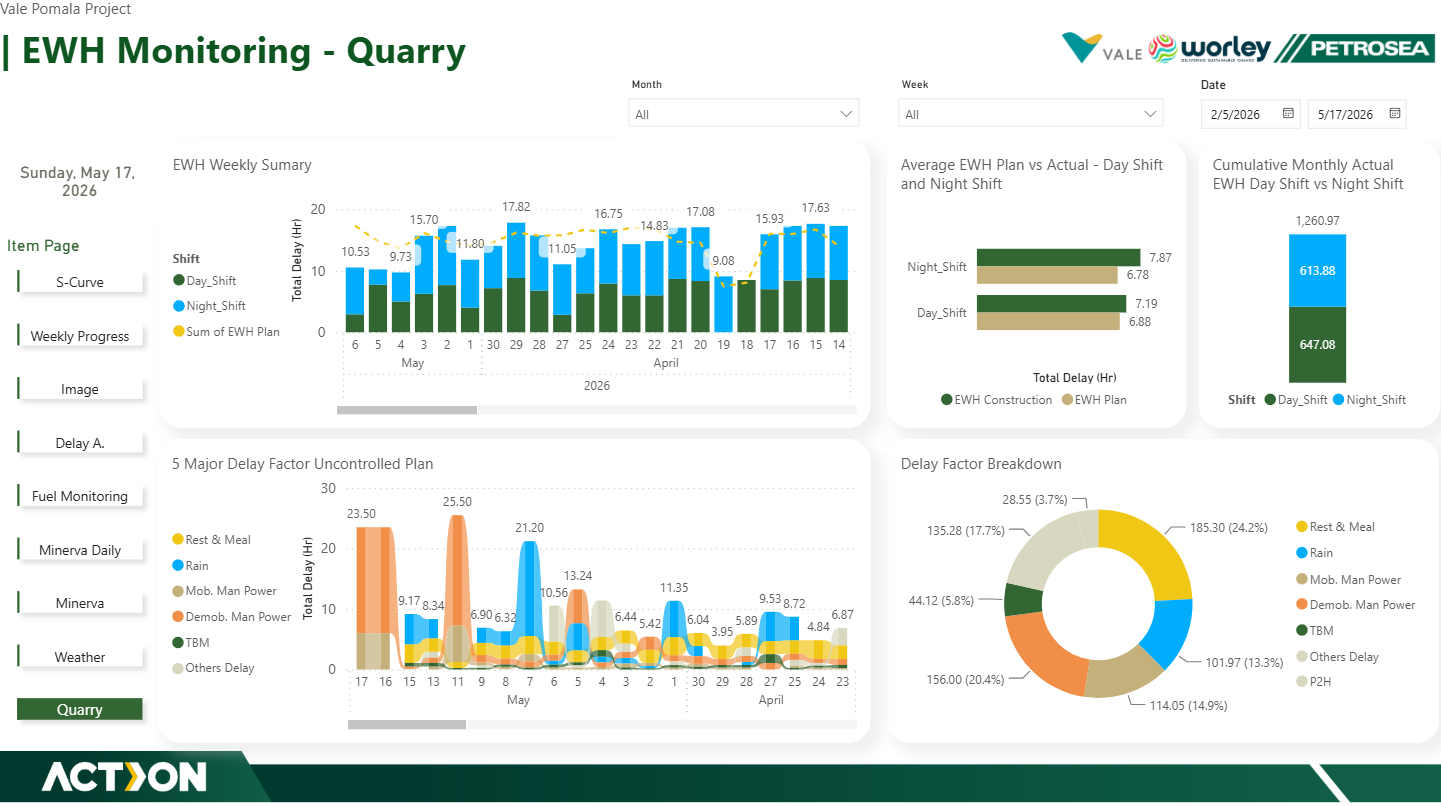
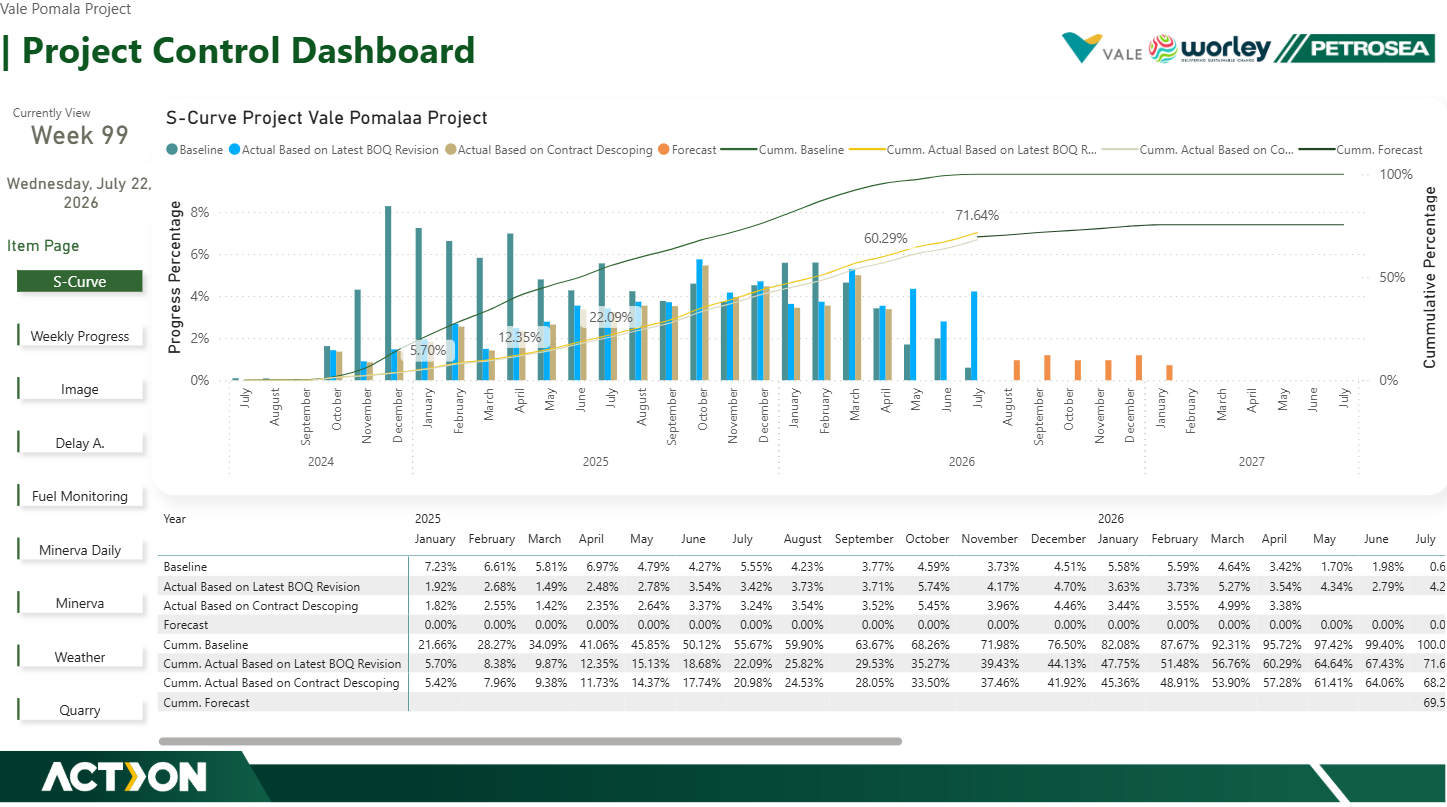
Architected a multi-module Power BI command center integrating S-Curve, workfront tracking, aerial mapping, delay categorization, fuel, and workforce.
Problem
A multi-stakeholder mega-project (Vale, Worley, Petrosea) created data silos across schedule, execution, fuel, attendance, and delays.
Solution
Architected a multi-module Power BI command center integrating S-Curve, workfront tracking, aerial mapping, delay categorization, fuel, and workforce.
Impact
Provided total operational transparency, bridging earned value milestones with field-level productivity.