Case Study 09 / 27Financial & Operational Intelligence / Subsidiary Asset Management / P&L Analytics
HBS Fleet Performance & Profitability Command Center
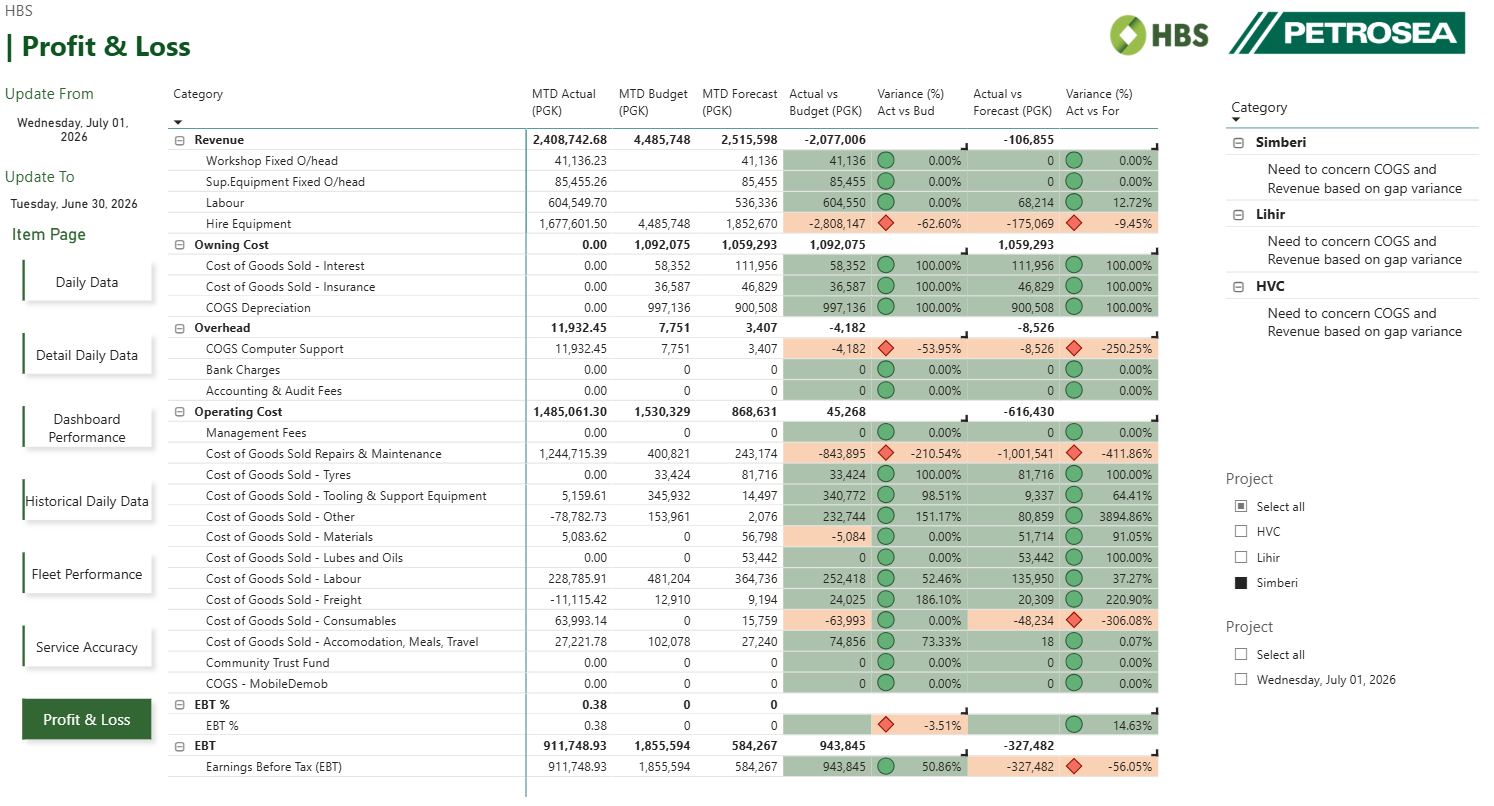
Designed a Power BI suite integrating fleet performance with financial statements (MTD Actual vs Budget/Forecast, COGS, EBT).
Problem
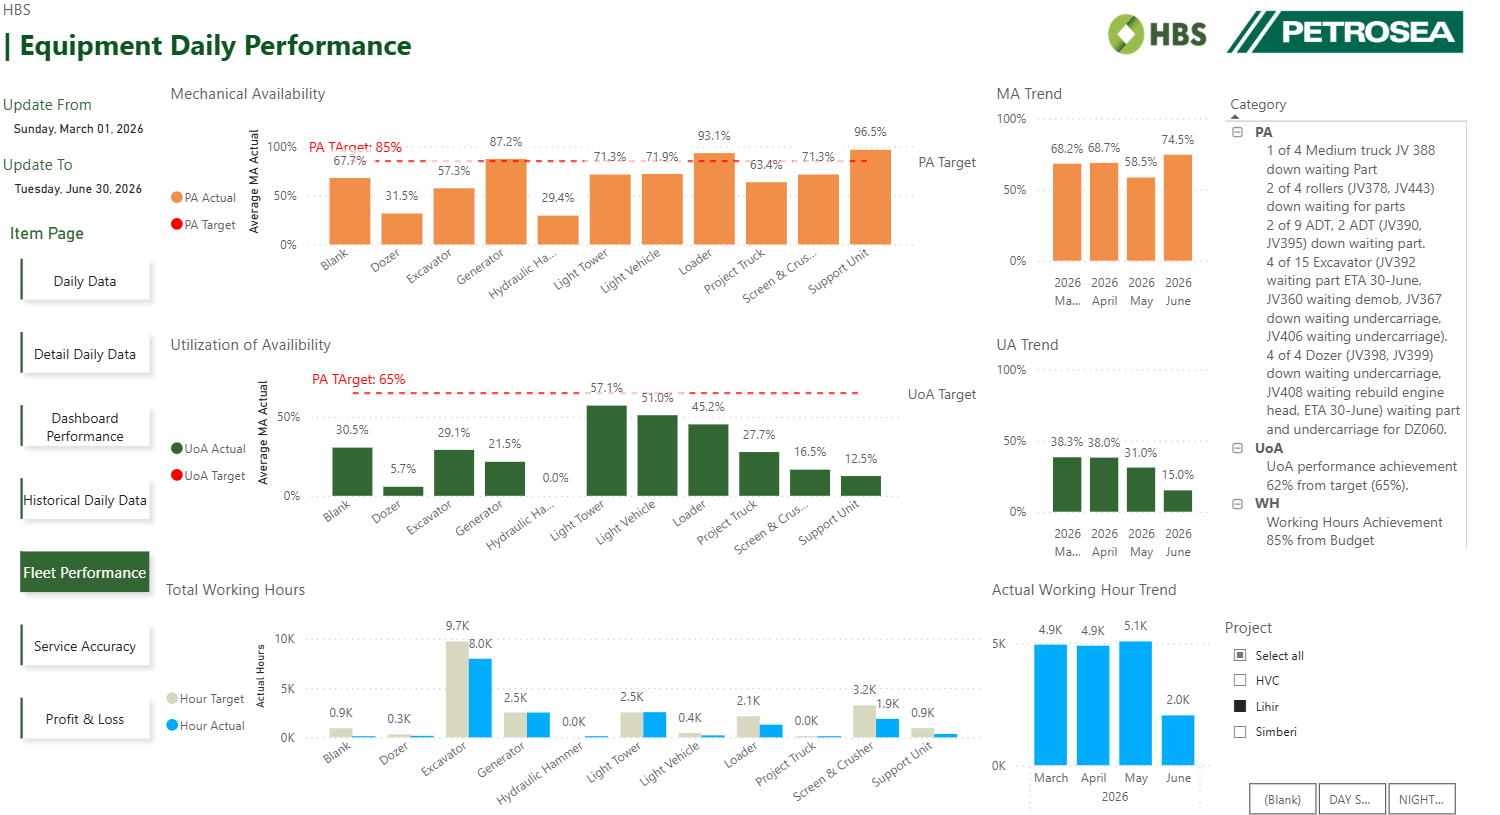
Post-acquisition, management lacked a layer connecting fleet efficiency with P&L outcomes across Simberi, HVC, Lihir.
Solution
Designed a Power BI suite integrating fleet performance with financial statements (MTD Actual vs Budget/Forecast, COGS, EBT).
Impact
Linked operational downtime and under-utilization to financial margin erosion across all three PNG operations.