Case Study 06 / 27Business Development / Strategic Planning / Data Analytics
Go Get Analysis & Client Engagement Platform
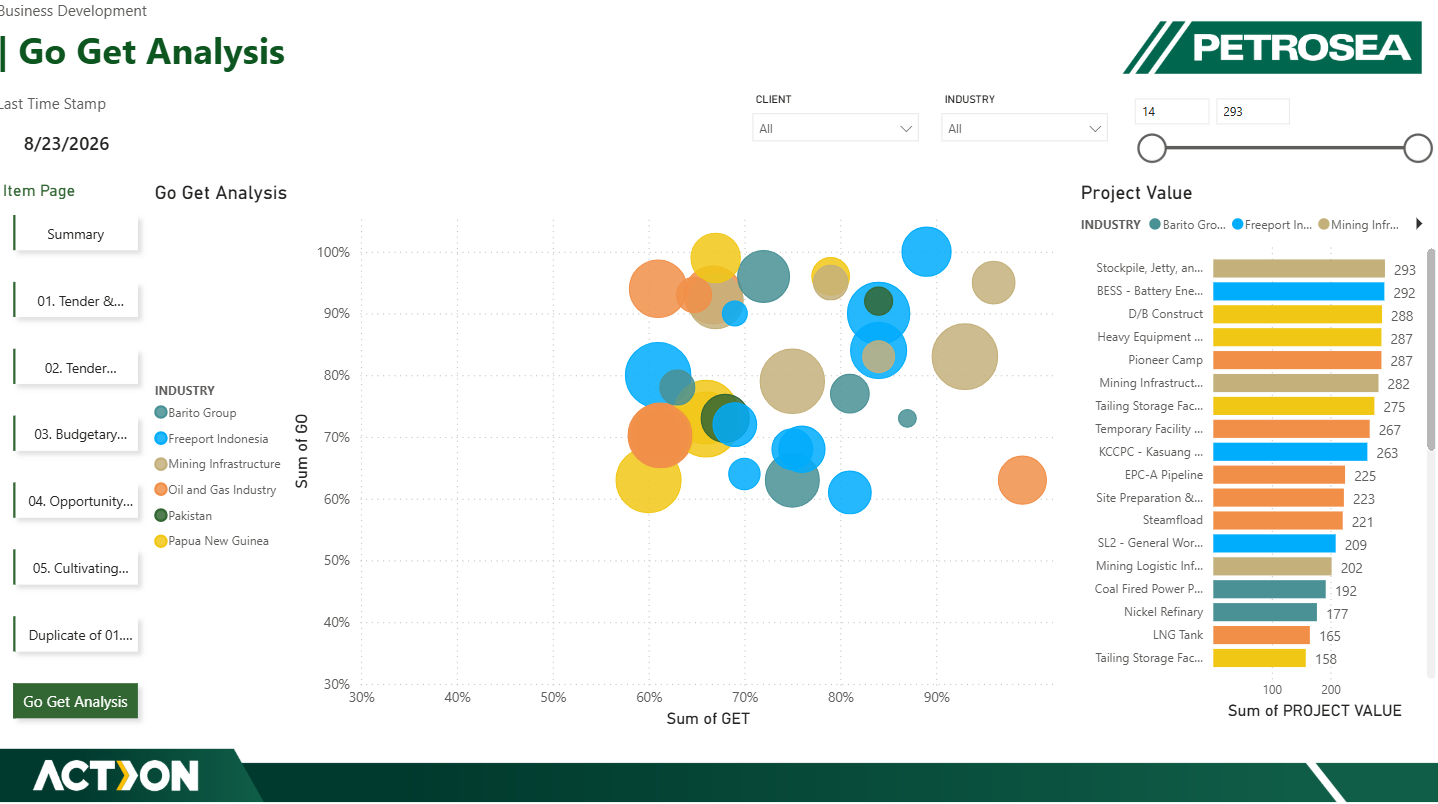
Developed a Power BI 'Go Get' matrix mapping the likelihood of proceeding (Go) against winning (Get) across industries and clients.
Problem
BD lacked a real-time mechanism to evaluate project pursuits and calculate win probabilities.
Solution
Developed a Power BI 'Go Get' matrix mapping the likelihood of proceeding (Go) against winning (Get) across industries and clients.
Impact
Enabled teams to visualize risk vs reward, prioritizing high-value, high-probability projects.


