Case Study 07 / 27Business Intelligence / Process Automation / Pipeline Management
Business Development Tender Summary & Pipeline Command Center
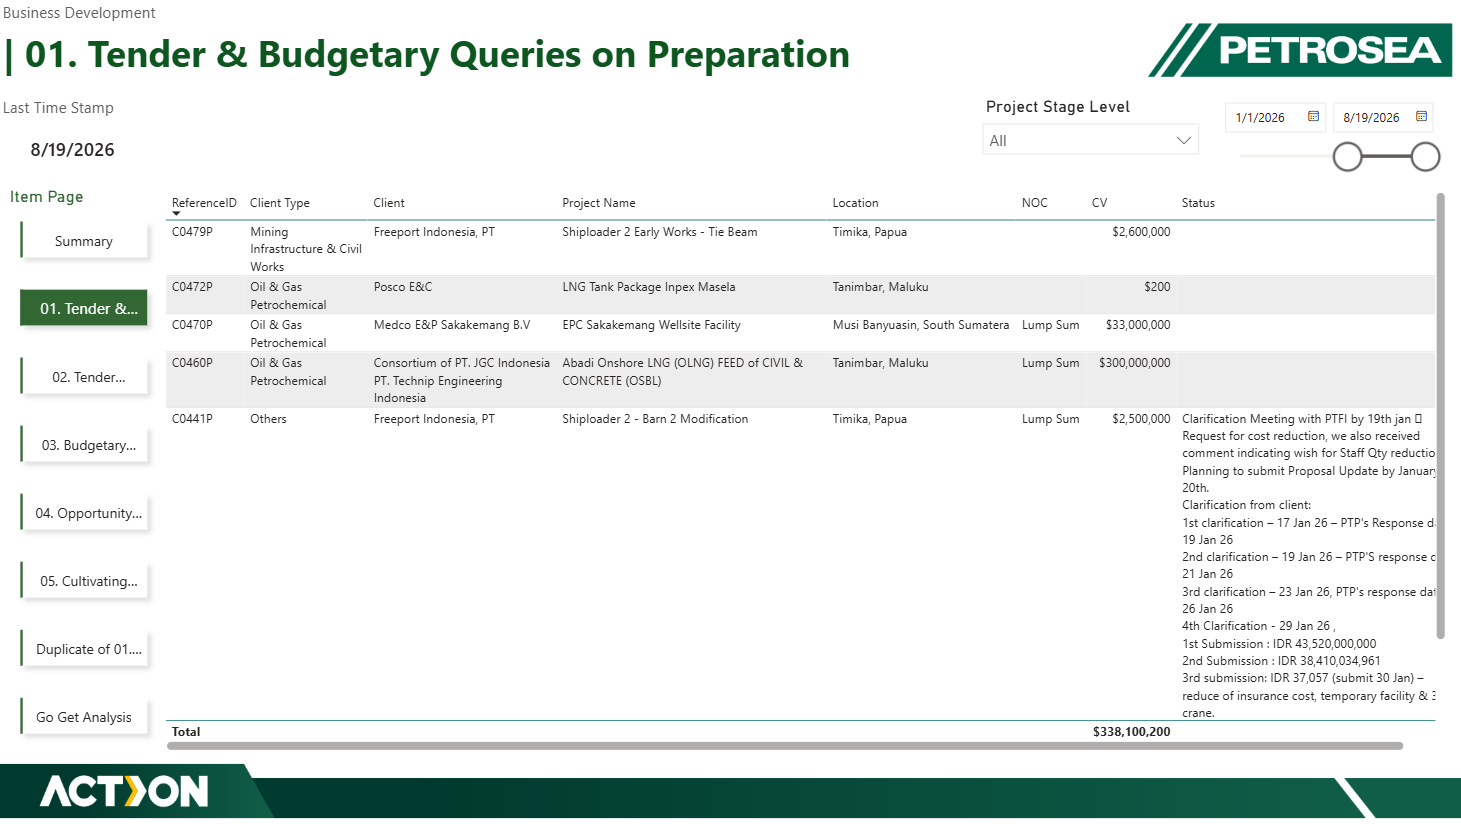
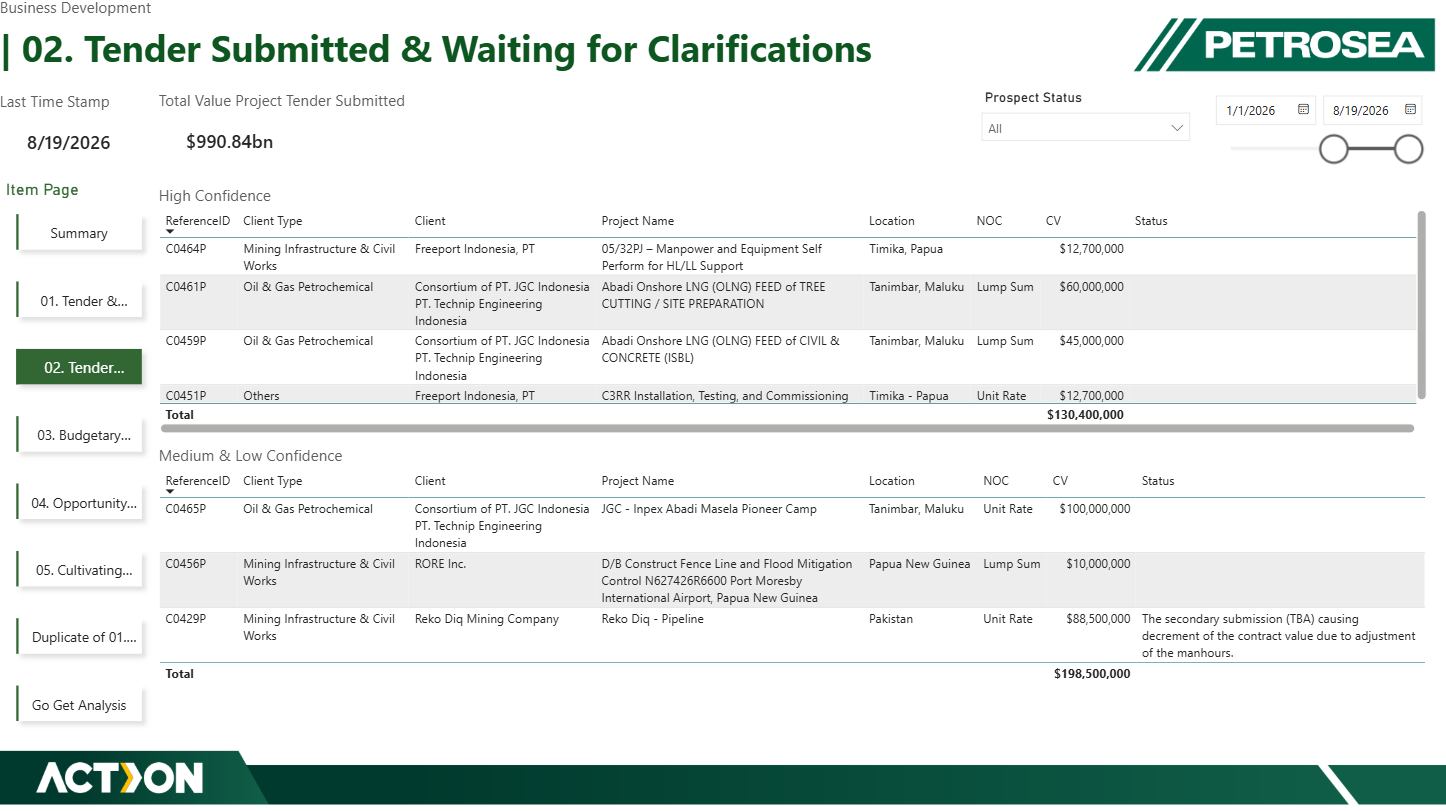
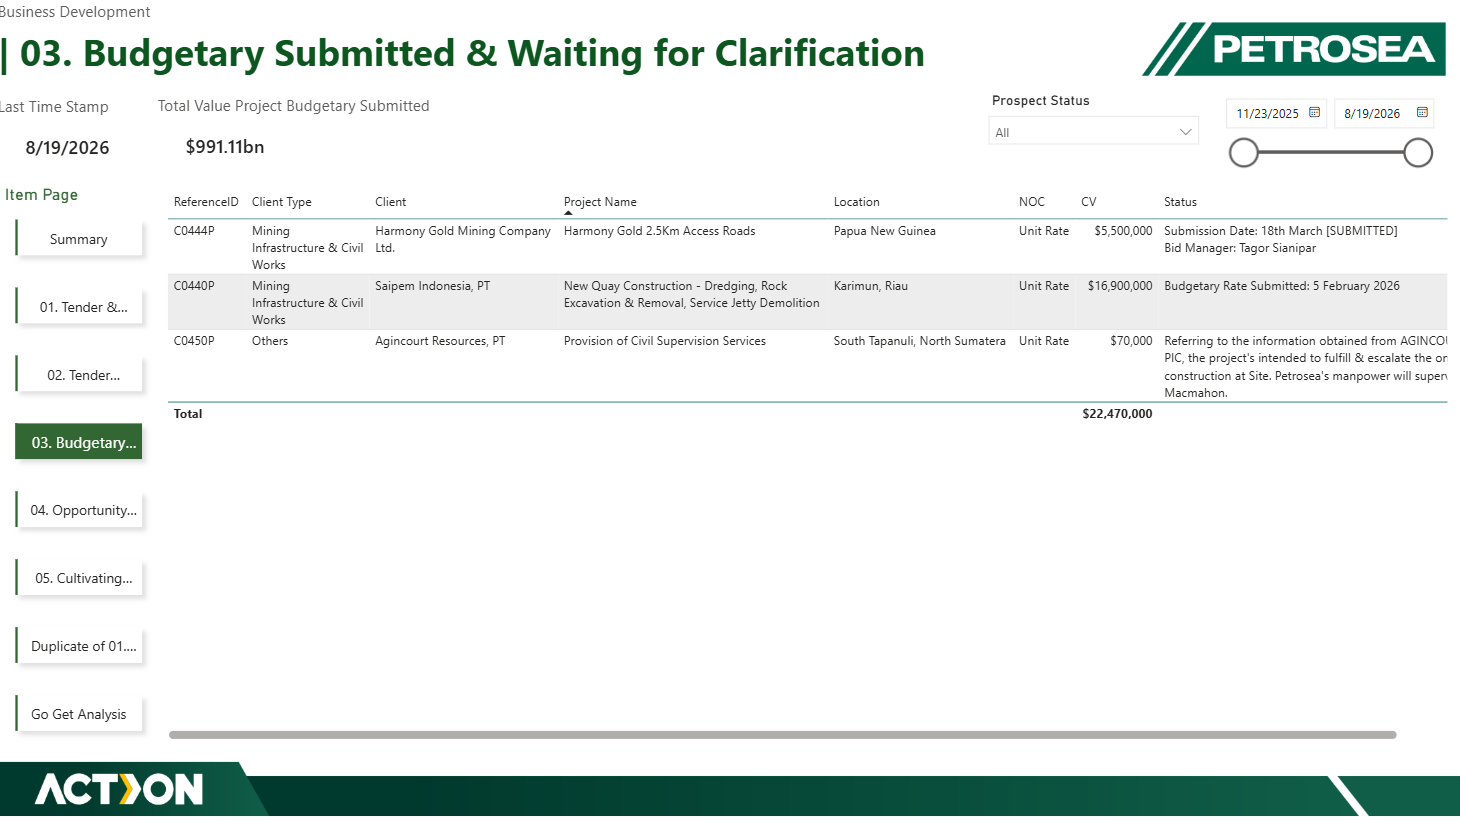
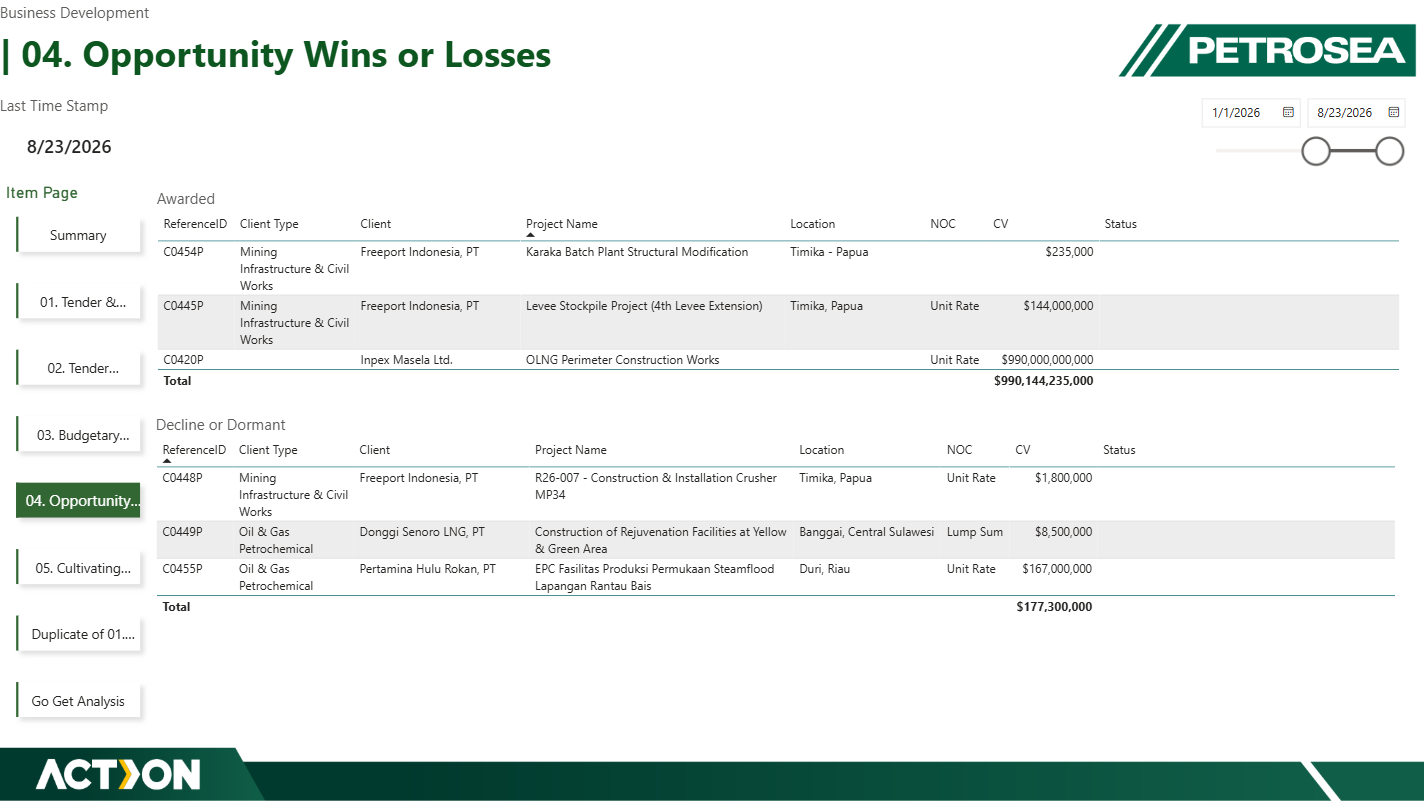
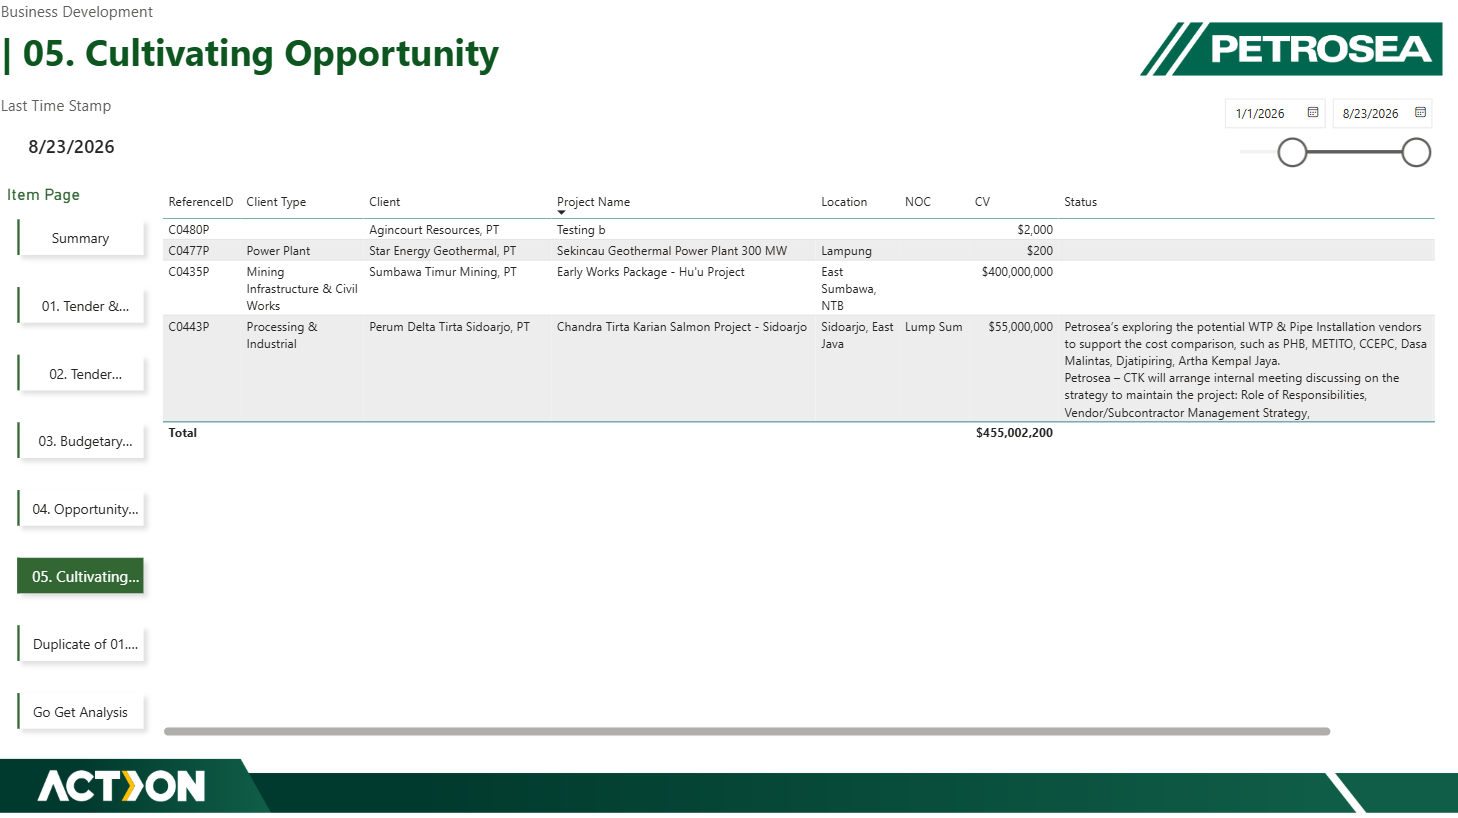
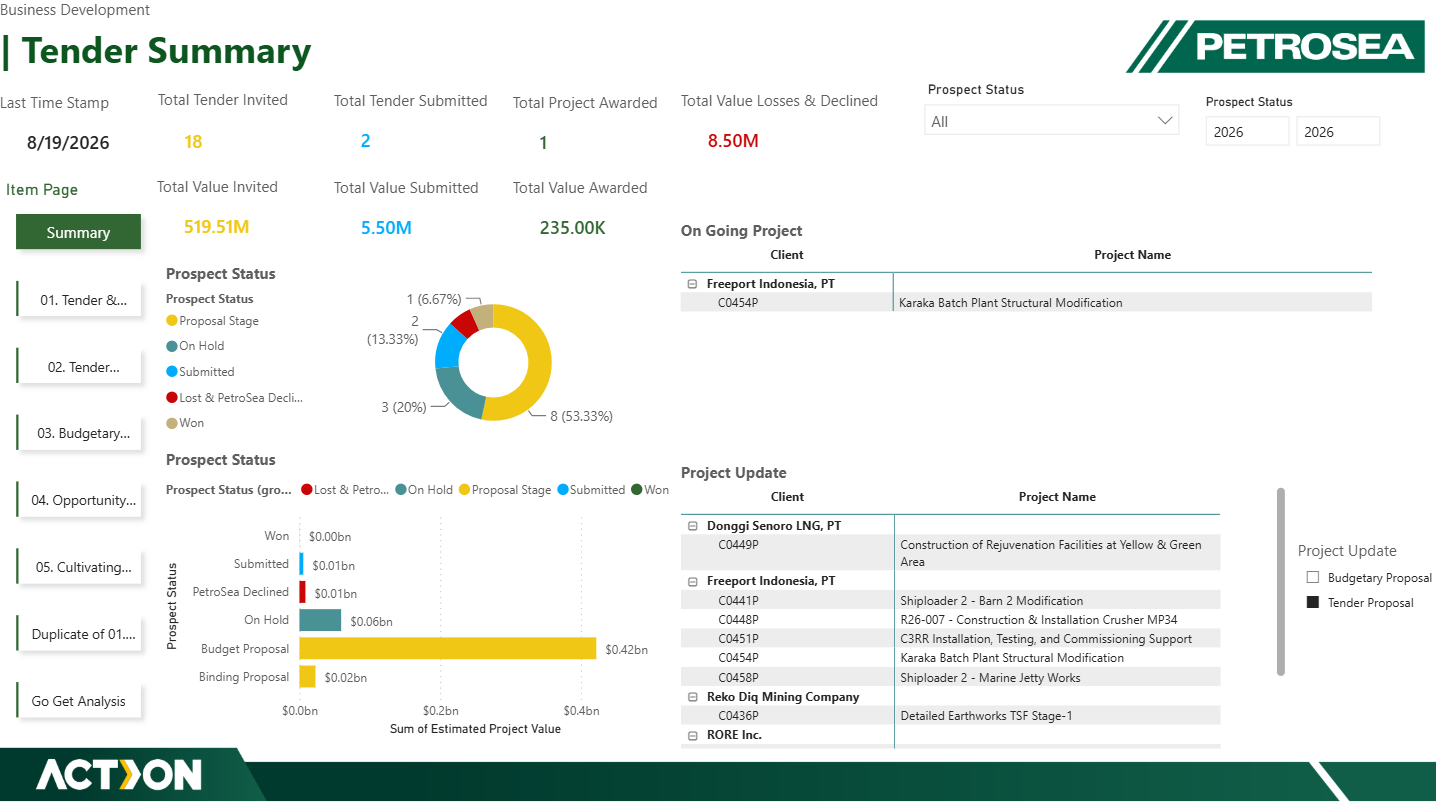
Engineered a Power BI dashboard integrated with a SharePoint list, tracking the BD lifecycle across five stages.
Problem
BD and BOD relied on manual PowerPoint to review pipelines, creating silos and consuming time.
Solution
Engineered a Power BI dashboard integrated with a SharePoint list, tracking the BD lifecycle across five stages.
Impact
Eliminated manual drafting, giving the BOD an instant view of prospect statuses, values, and win/loss ratios.