Furqon E. Muhammad← Portfolio
Case Study 05 / 27Executive Business Intelligence / Project Controls / Cost Engineering

Reko Diq Project Control & Executive Reporting Dashboard

Architected an automated Power BI template integrating EVM, cost commitments, S-Curves, and SHE metrics.
05 — EPC & Mining AnalyticsReko Diq Project Control & Executive Reporting Dashboard
PT. Petrosea Tbk · Pakistan (K402) · 2026
Problem

The Jakarta HO and BOD lacked real-time visibility into the overseas K402 Reko Diq project's health.

Solution

Architected an automated Power BI template integrating EVM, cost commitments, S-Curves, and SHE metrics.

Impact

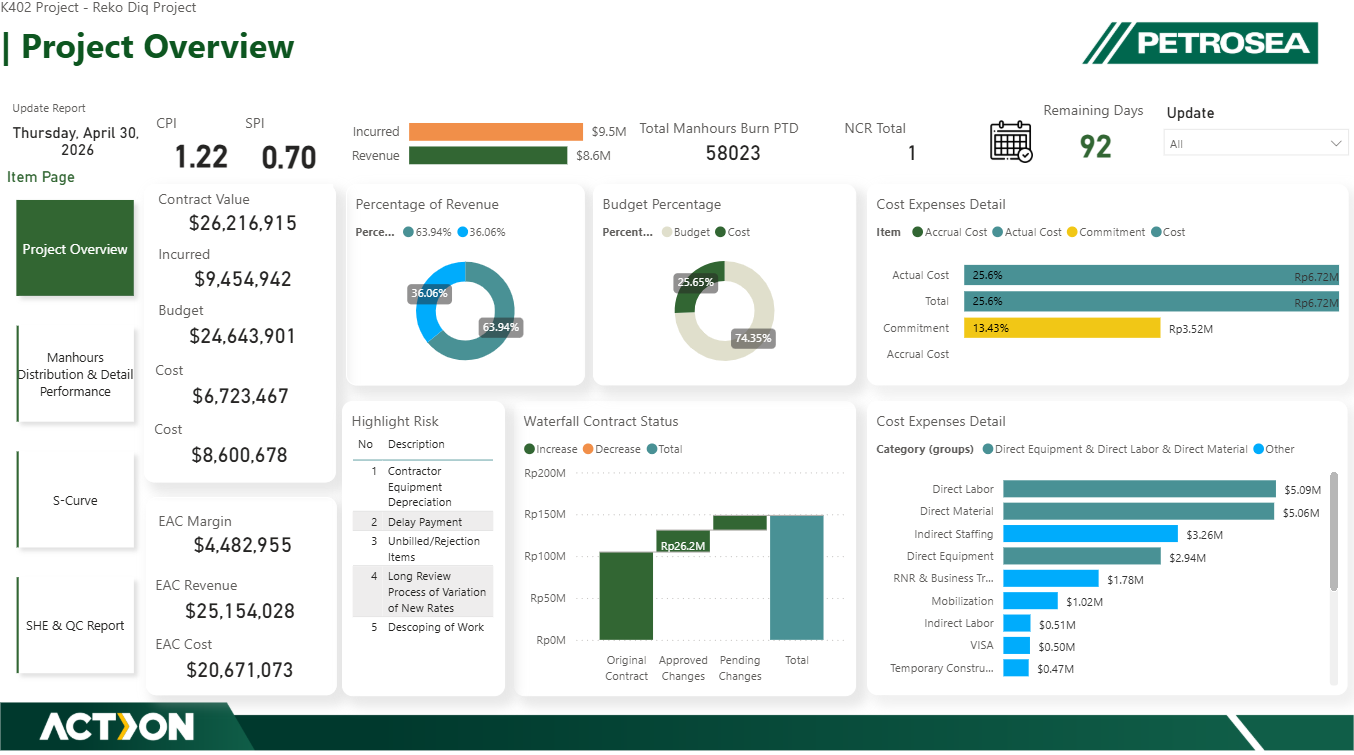
Transformed biweekly BOD reviews with instant diagnostics (SPI 0.70, CPI 1.22), establishing a scalable governance template.
Reko Diq Project Control & Executive Reporting Dashboard05 / 27
A Executive Summary

Overview

05 / 27
Project No.
05
Client / Org
PT. Petrosea Tbk
Role
Project Control BI Architect
Year
2026
Location
Pakistan (K402)
Discipline
EPC & Mining Analytics

A Project Control intelligence suite for executive oversight of K402 Reko Diq—the bridge between overseas execution and the Jakarta HO.

Overview — Project Exhibits4 images · add up to 05.12
Reko Diq Project Control & Executive Reporting Dashboard — exhibit 05.1
PT. Petrosea Tbk · 2026 · Exhibit 05.1
Reko Diq Project Control & Executive Reporting Dashboard — exhibit 05.2
PT. Petrosea Tbk · 2026 · Exhibit 05.2
Reko Diq Project Control & Executive Reporting Dashboard — exhibit 05.3
PT. Petrosea Tbk · 2026 · Exhibit 05.3
Reko Diq Project Control & Executive Reporting Dashboard — exhibit 05.4
PT. Petrosea Tbk · 2026 · Exhibit 05.4
Reko Diq Project Control & Executive Reporting Dashboard — exhibit 05.5
PT. Petrosea Tbk · 2026 · Exhibit 05.5
Reko Diq Project Control & Executive Reporting Dashboard — exhibit 05.6
PT. Petrosea Tbk · 2026 · Exhibit 05.6
Reko Diq Project Control & Executive Reporting Dashboard — exhibit 05.7
PT. Petrosea Tbk · 2026 · Exhibit 05.7
Reko Diq Project Control & Executive Reporting Dashboard — exhibit 05.8
PT. Petrosea Tbk · 2026 · Exhibit 05.8
Reko Diq Project Control & Executive Reporting Dashboard — exhibit 05.9
PT. Petrosea Tbk · 2026 · Exhibit 05.9
Reko Diq Project Control & Executive Reporting Dashboard — exhibit 05.10
PT. Petrosea Tbk · 2026 · Exhibit 05.10
Reko Diq Project Control & Executive Reporting Dashboard — exhibit 05.11
PT. Petrosea Tbk · 2026 · Exhibit 05.11
Reko Diq Project Control & Executive Reporting Dashboard — exhibit 05.12
PT. Petrosea Tbk · 2026 · Exhibit 05.12
Executive Summary05 / 27
B Outcomes

Strategic Business Impact

05 / 27
01

Earned Value & Financial Health

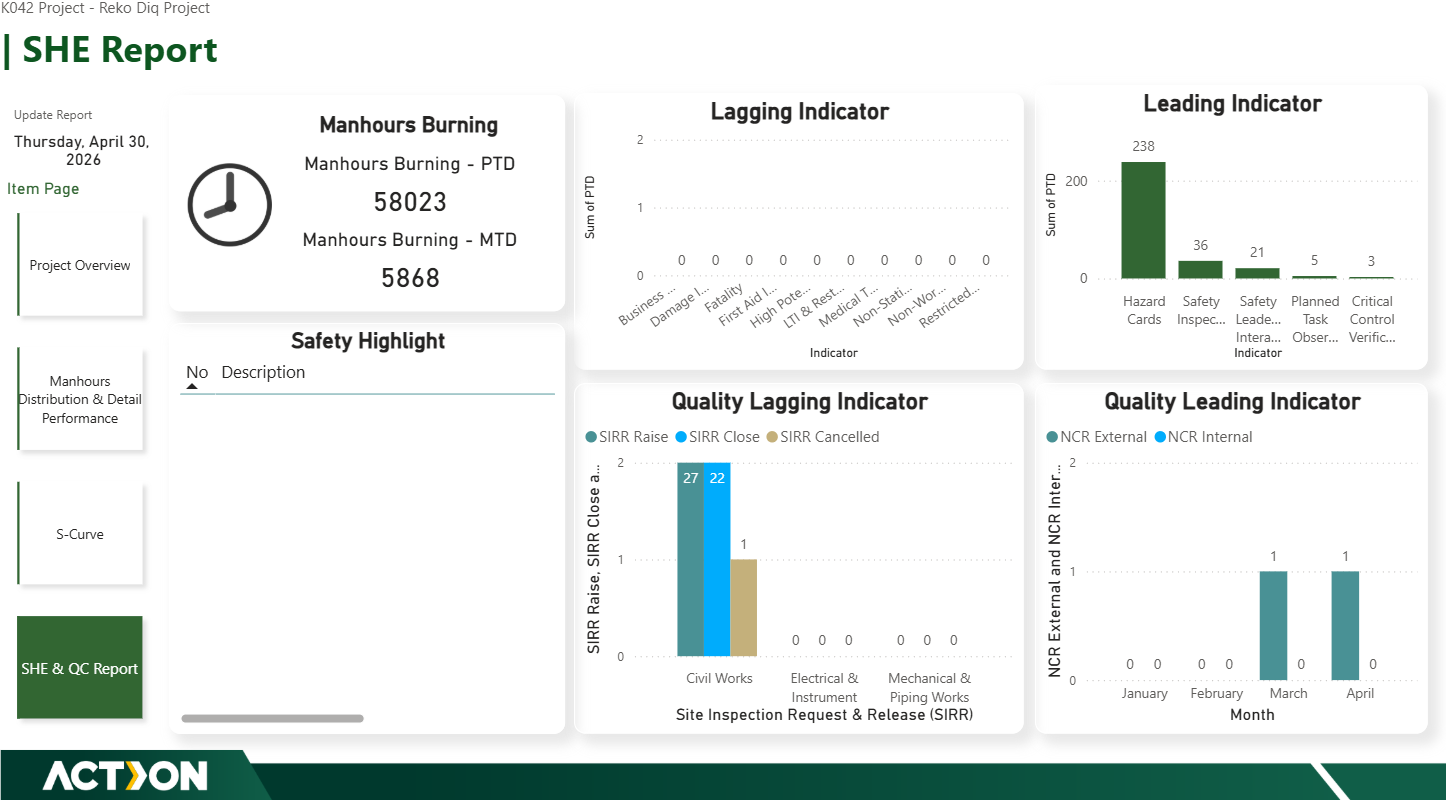
Visibility into a $26.2M Contract Value, tracking Incurred Costs ($9.45M) and indices (CPI 1.22, SPI 0.70).

02

Cost vs. Revenue Granularity

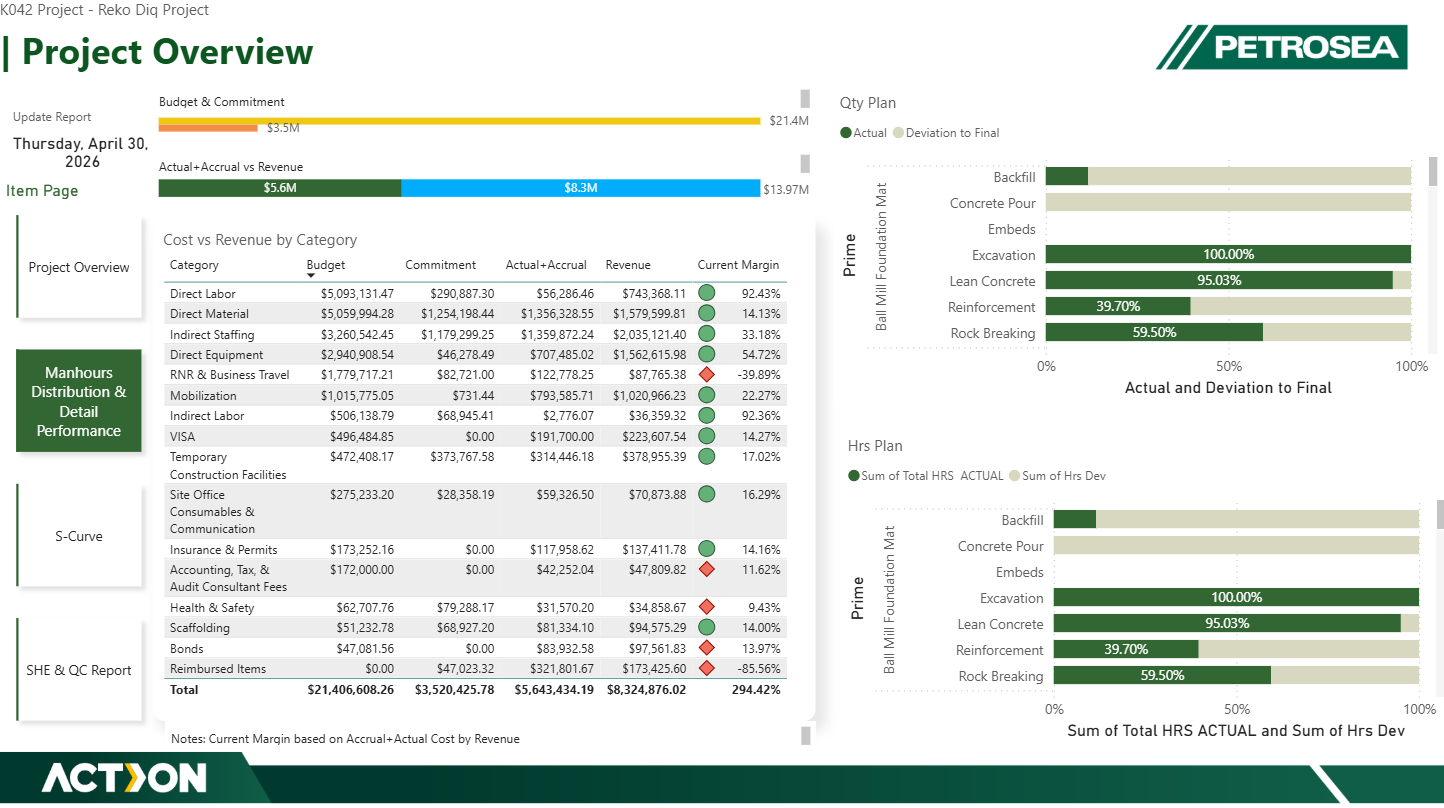
Unpacked commitments across categories (Direct Labor/Material, Indirect Equipment, Mobilization).

03

Progress Tracking & Forecasting

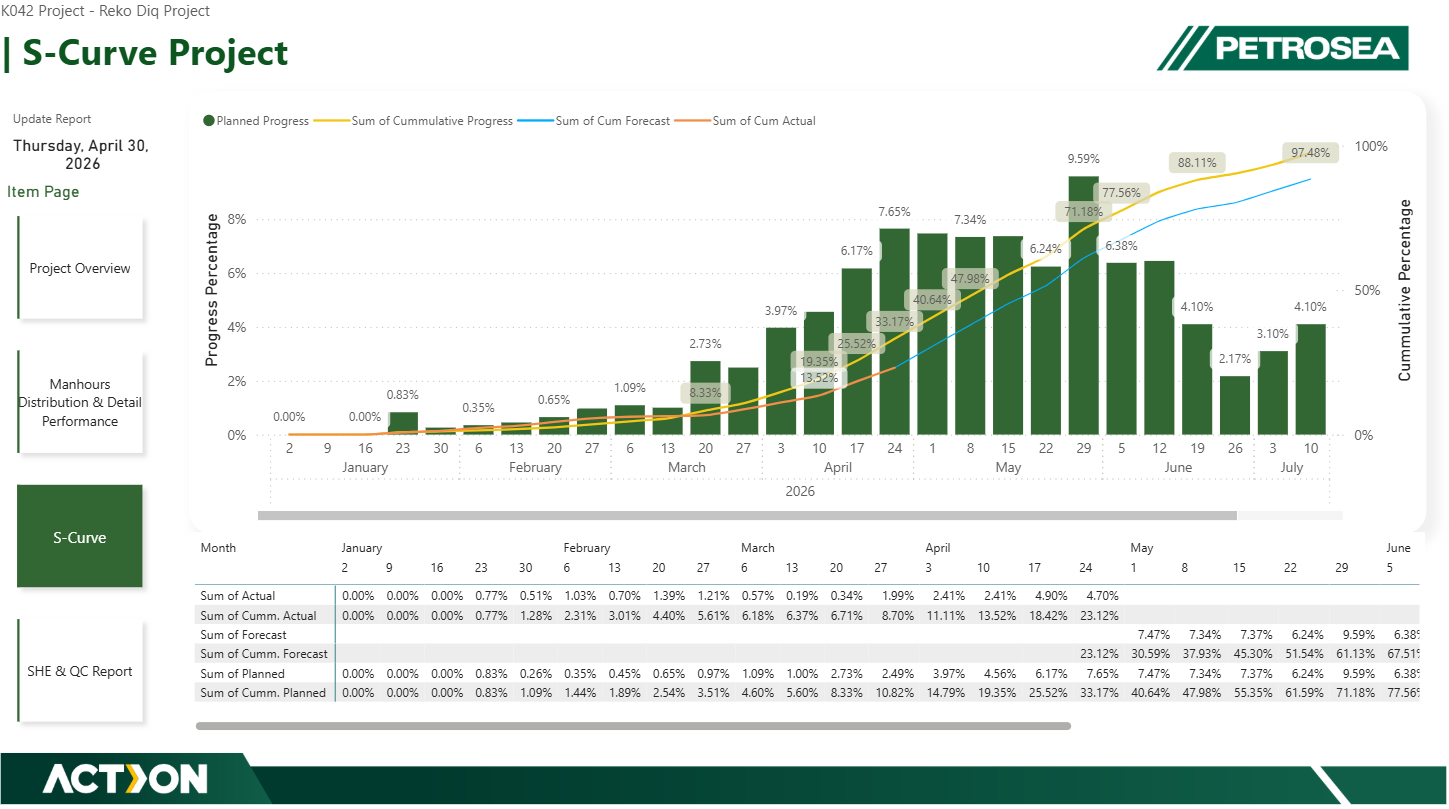
Automated the S-Curve to benchmark Planned vs Actual vs Forecast progress.

04

Risk & Quality Governance

A SHE & QC module tracking Hazard Cards, SIRR Requests, and NCRs.

Strategic Business Impact05 / 27
C Delivery

End-to-End Ownership & Technical Execution

05 / 27
01

Data Architecture & Integration

Fused cost ledgers, schedules, and safety logs into a relational DAX model with multi-currency handling.

02

UI/UX & Business Intelligence

A 4-tier narrative (Overview → Detail → S-Curve → SHE & QC) for BOD meetings.

03

Process Standardization

A baseline template for monitoring overseas project controls from Jakarta.

Power BIEarned ValueS-CurveCPI/SPIBOD Reporting
Technical Execution05 / 27
ContinueCase 05 / 27