Furqon E. Muhammad← Portfolio
Case Study 12 / 27Marine Logistics / Fleet Intelligence / 3D-Vendor GPS Integration

BP UCC Early Works Marine Fleet Management & Fuel Dashboard

Architected a Power BI marine suite integrating GPS and fuel feeds, merging Vessel Performance and Voyage Summary modules.
12 — Digital TransformationBP UCC Early Works Marine Fleet Management & Fuel Dashboard
PT. Petrosea Tbk · Papua · 2025
Problem

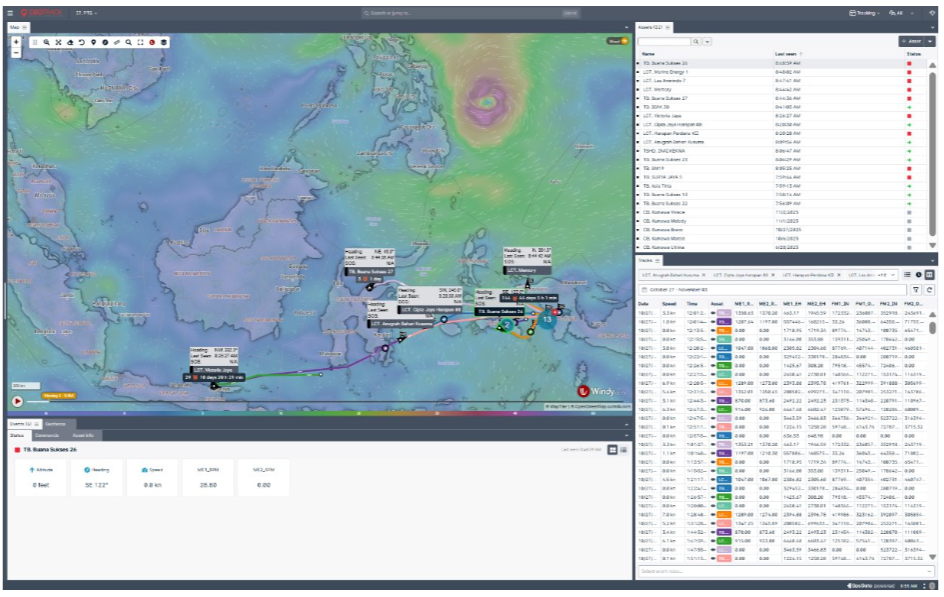
Tracking marine vessels and fuel relied on disjointed third-party data, preventing audit of route efficiency and fuel burn.

Solution

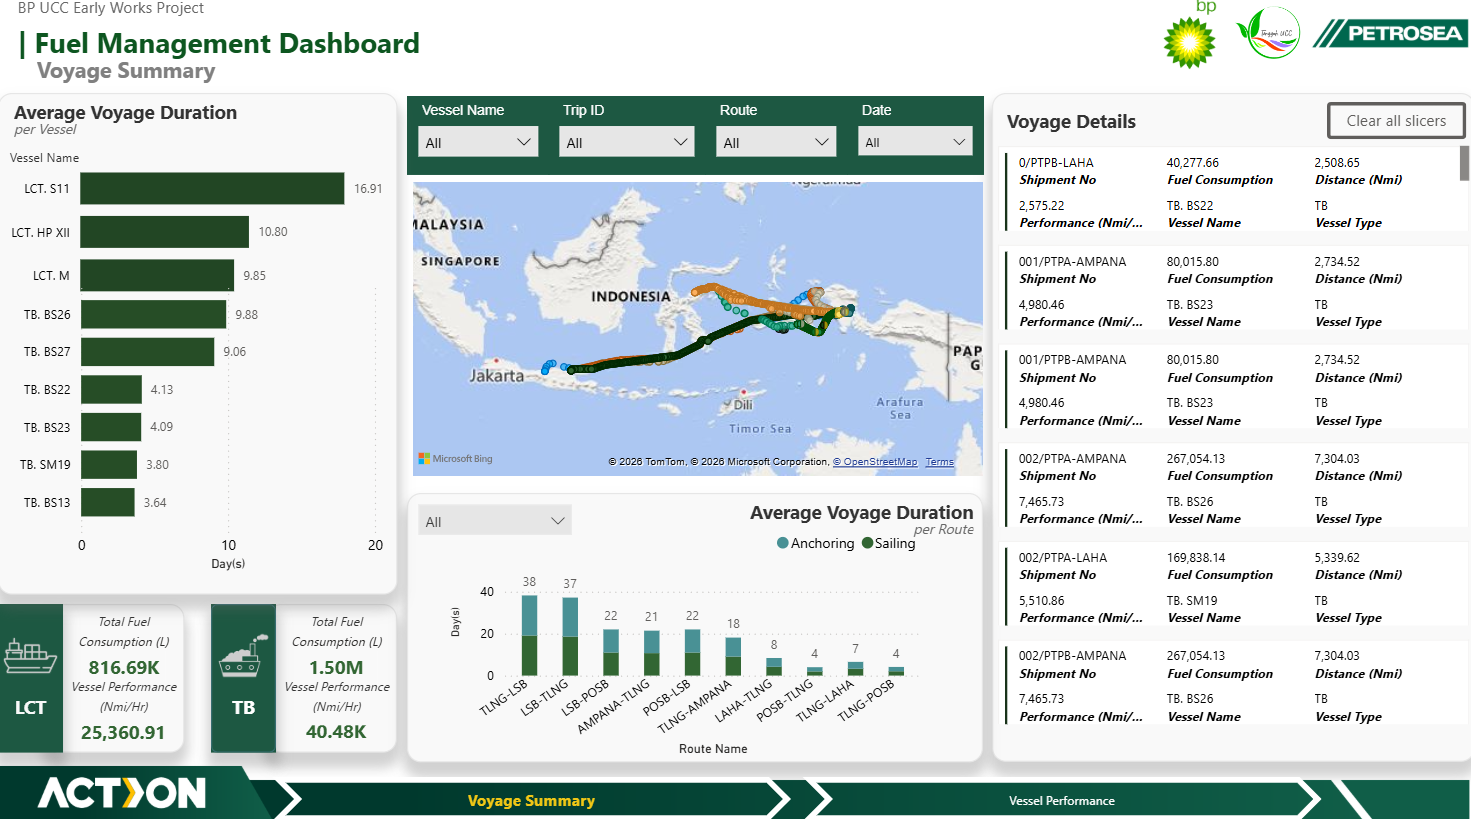
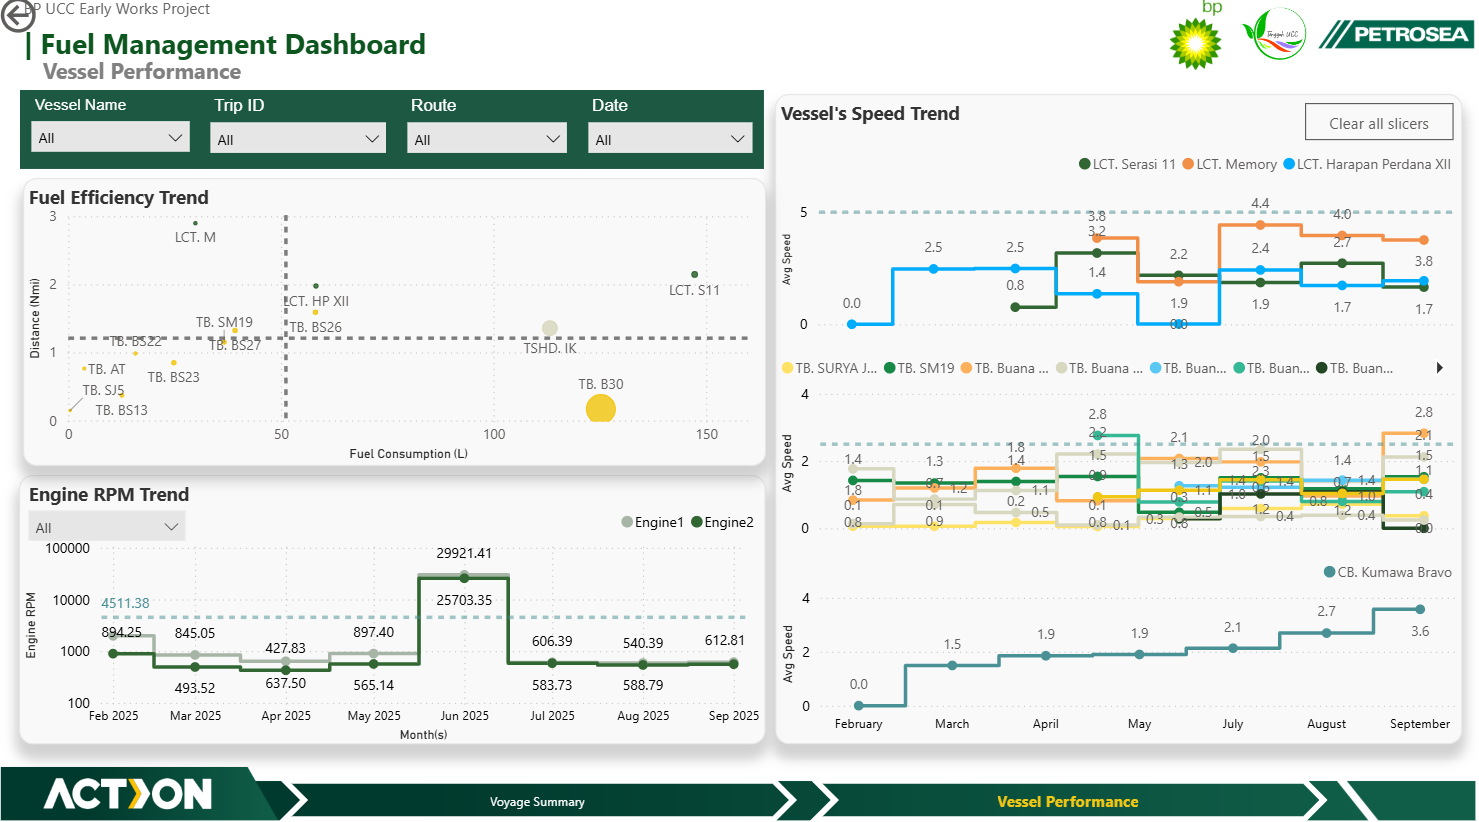
Architected a Power BI marine suite integrating GPS and fuel feeds, merging Vessel Performance and Voyage Summary modules.

Impact

Provided complete visibility into fleet operations, optimizing fuel and tracking transit times.
BP UCC Early Works Marine Fleet Management & Fuel Dashboard12 / 27
A Executive Summary

Overview

12 / 27
Project No.
12
Client / Org
PT. Petrosea Tbk
Role
Marine BI Lead
Year
2025
Location
Papua
Discipline
Digital Transformation

A Fuel and Vessel Management dashboard for BP UCC Early Works, ingesting telemetry across LCTs and Tugs.

Overview — Project Exhibits2 images · add up to 12.12
BP UCC Early Works Marine Fleet Management & Fuel Dashboard — exhibit 12.1
PT. Petrosea Tbk · 2025 · Exhibit 12.1
BP UCC Early Works Marine Fleet Management & Fuel Dashboard — exhibit 12.2
PT. Petrosea Tbk · 2025 · Exhibit 12.2
BP UCC Early Works Marine Fleet Management & Fuel Dashboard — exhibit 12.3
PT. Petrosea Tbk · 2025 · Exhibit 12.3
BP UCC Early Works Marine Fleet Management & Fuel Dashboard — exhibit 12.4
PT. Petrosea Tbk · 2025 · Exhibit 12.4
BP UCC Early Works Marine Fleet Management & Fuel Dashboard — exhibit 12.5
PT. Petrosea Tbk · 2025 · Exhibit 12.5
BP UCC Early Works Marine Fleet Management & Fuel Dashboard — exhibit 12.6
PT. Petrosea Tbk · 2025 · Exhibit 12.6
BP UCC Early Works Marine Fleet Management & Fuel Dashboard — exhibit 12.7
PT. Petrosea Tbk · 2025 · Exhibit 12.7
BP UCC Early Works Marine Fleet Management & Fuel Dashboard — exhibit 12.8
PT. Petrosea Tbk · 2025 · Exhibit 12.8
BP UCC Early Works Marine Fleet Management & Fuel Dashboard — exhibit 12.9
PT. Petrosea Tbk · 2025 · Exhibit 12.9
BP UCC Early Works Marine Fleet Management & Fuel Dashboard — exhibit 12.10
PT. Petrosea Tbk · 2025 · Exhibit 12.10
BP UCC Early Works Marine Fleet Management & Fuel Dashboard — exhibit 12.11
PT. Petrosea Tbk · 2025 · Exhibit 12.11
BP UCC Early Works Marine Fleet Management & Fuel Dashboard — exhibit 12.12
PT. Petrosea Tbk · 2025 · Exhibit 12.12
Executive Summary12 / 27
B Outcomes

Strategic Business Impact

12 / 27
01

Fuel Efficiency & Consumption Analytics

Correlates fuel burn (L) against distance (Nmi) and speed, isolating outliers.

02

Voyage Route Optimization

Analyzes durations by route and phase (Anchoring vs Sailing).

03

Engine & Telemetry Monitoring

Tracks engine RPM and speed to minimize mechanical wear.

Strategic Business Impact12 / 27
C Delivery

End-to-End Ownership & Technical Execution

12 / 27
01

Data Integration & Telemetry

Merged GPS feeds, telemetry, and voyage logs into a relational model.

02

UI/UX & Business Intelligence

Spatial route mapping (Bing maps), vessel matrices, shipment tables.

03

Operational Oversight

Bridged vendor tracking with executive logistics reporting.

Power BIMarine LogisticsGPS TelemetryFuelRoute Mapping
Technical Execution12 / 27
ContinueCase 12 / 27